This tutorial shows a quick and intuitive explanation of how ASACO works. The following image shows the main page which we will explain by means of an example.
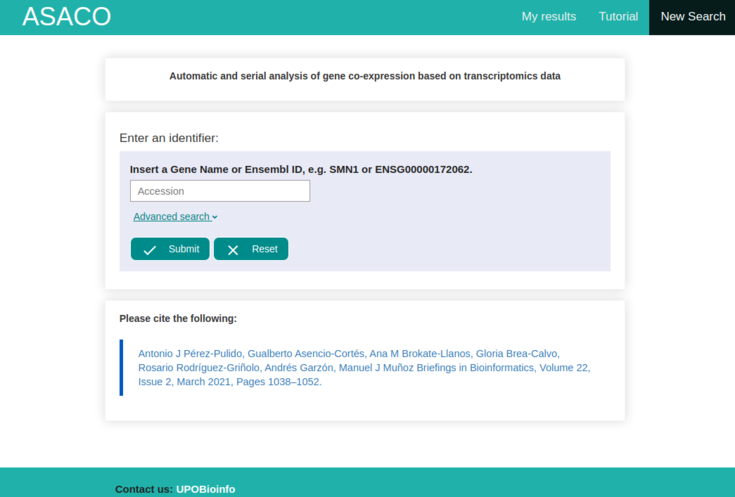

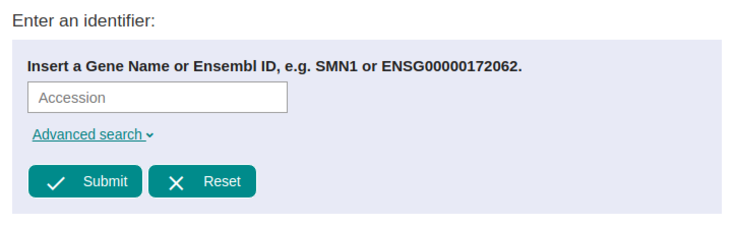
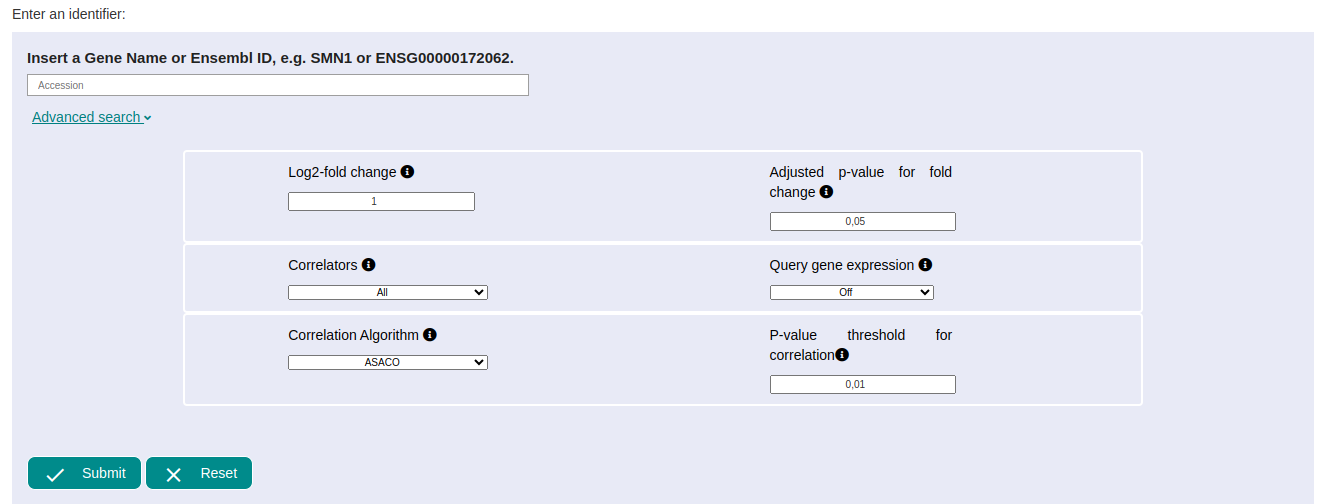
Let's start with the example! For this we are going to use the SMN1 gene as indicated in our form
Once the data starts to be processed, a status bar appears. This process may take several minutes (although the cache system can make them appear in a few seconds).
The different results are shown below. In this case, two types of correlation appears, one positive and one negative for the SMN1 gene; it is due to we have left the option 'All' in the correlators parameter by default. For seeing the different results, just click on the name SMN1 Positive Off ASACO or SMN1 Negative Off ASACO.
For each result, a correlation distribution, as well as a positive or negative correlation image will be displayed.
Correlation distribution
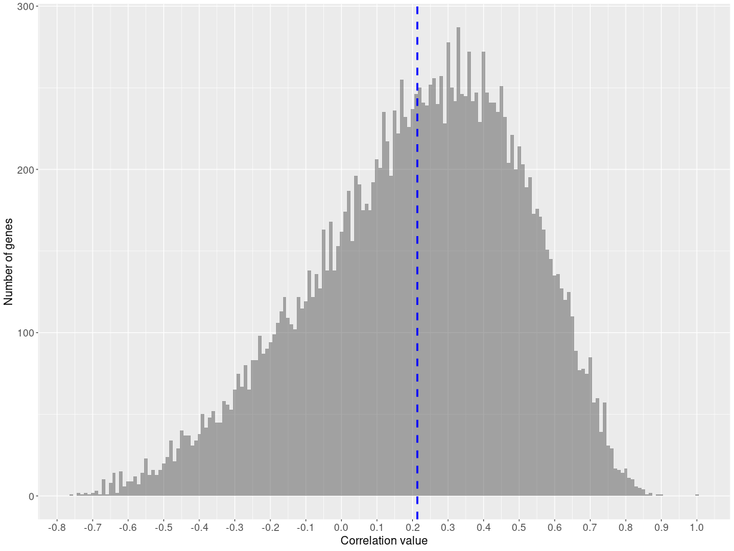
Positive correlation distribution
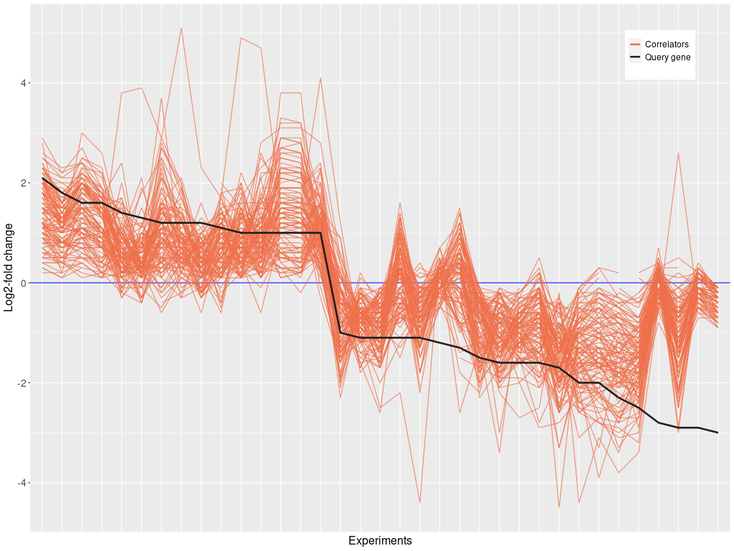
In this case, we can see that our query gene has a similar expression profile to correlators genes obtained within the experiments. On the other hand, in the negative correlation, the negative profile of our query gene will be opposite to the correlators.
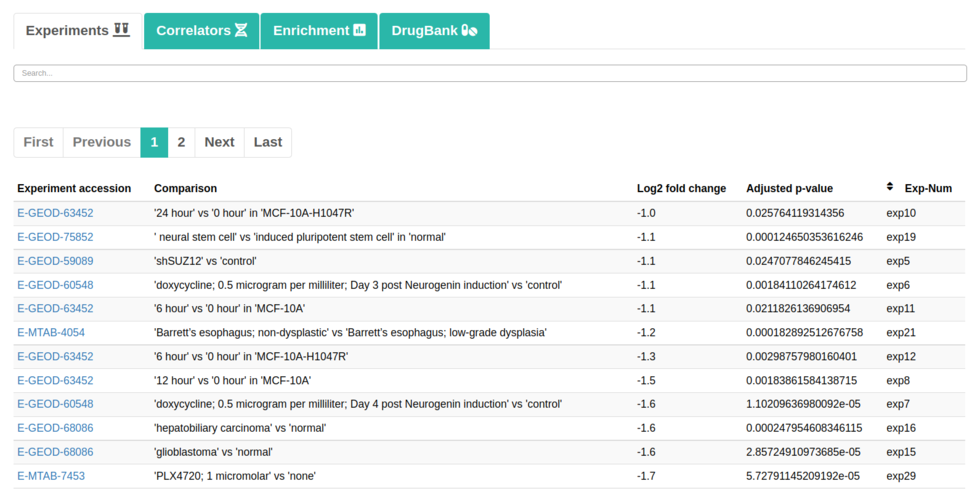
In addition, you can check the following tabs:
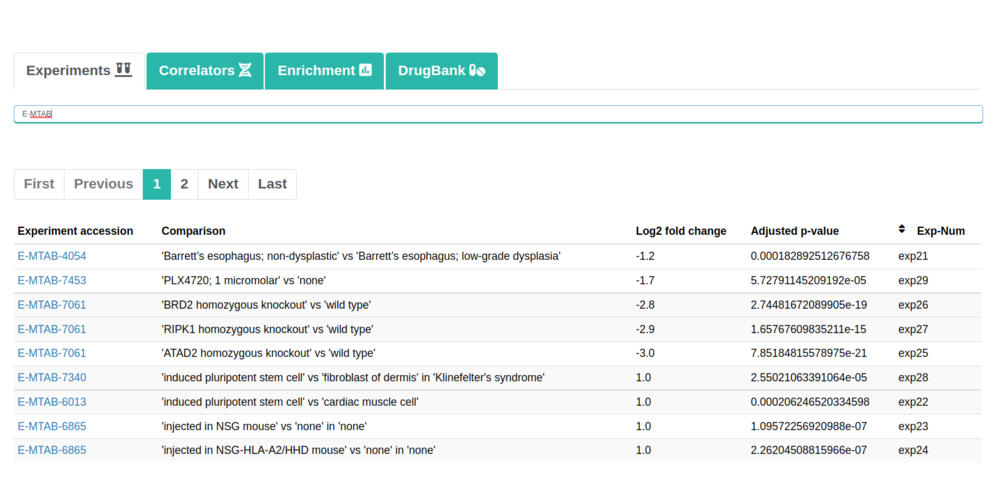
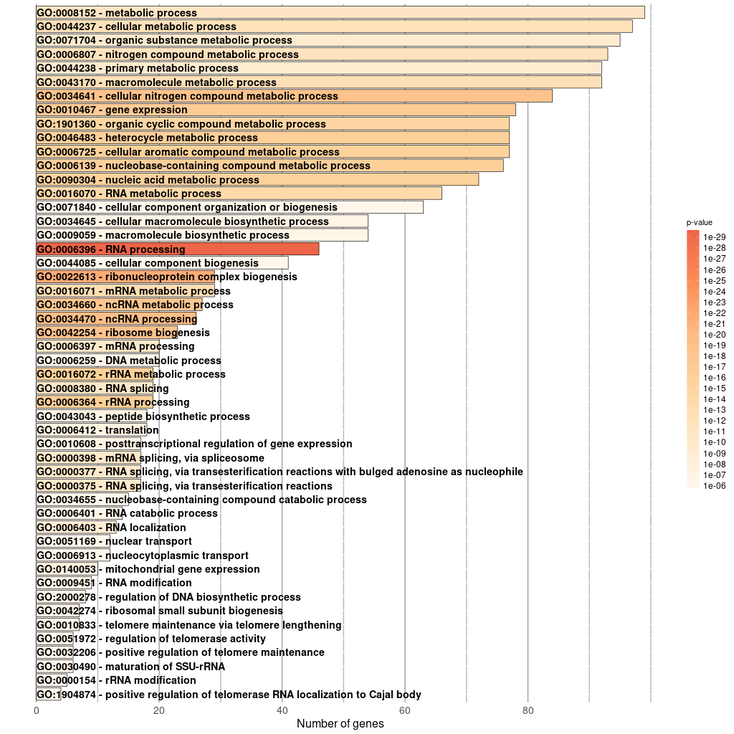
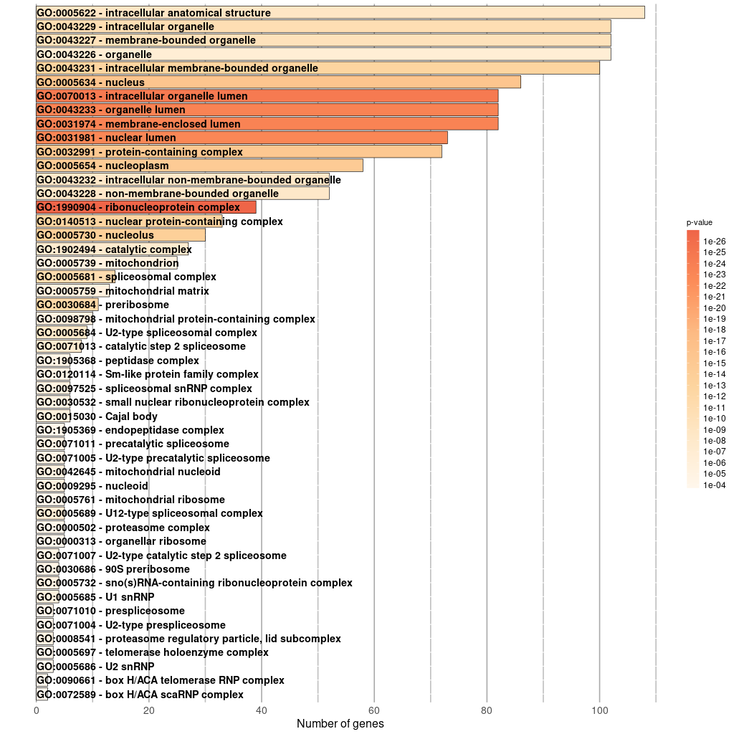
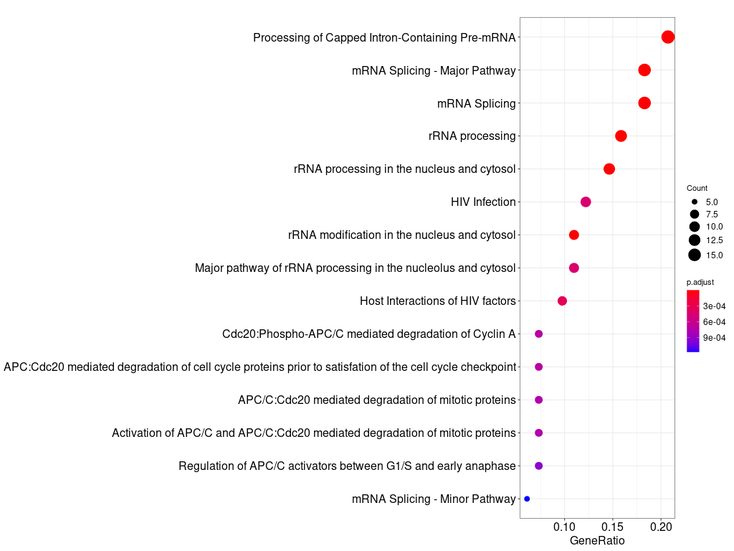
It should be noted in the enrichment section that 4 sections will be shown. They would be Enrichment BP (Biological Processes), Enrichment CC (Cellular Components), Enrichment KEGG (Pathways) and Enrichment REACTOME (Pathways). Each of them will contain its own information table, representative image and a button to download the data.
For our query gene we obtained this results:
Enrichment Biological Process
Enrichment Cellular Component
Enrichment REACTOME
Please, if you are going to use the DrugBank results in a future publication, do not forget to cite the following reference.
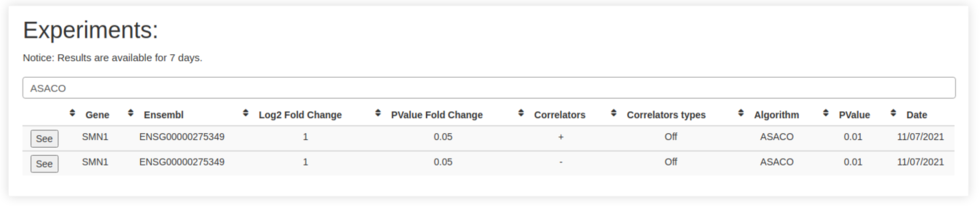
Results
will be stored for 7 days. They can be accessed from the
upper left tab 'My results'. There, the list of all of them is
displayed, and you can access again to it by the button 'See'.